4 Spec E Software: spectroscopic analysis
4 Spec E serves as comprehensive and user friendly spectroscopic analysis tool
4 Spec E provides extended functions for spectroscopy applications of ultra-high speed ICCD camera systems. The combination of ICCD cameras with a spectrometer gives researcher and developer a unique tool to discover highly dynamic processes. The 4 Spec E software enables the spectrum extraction from the 2D raw image, the spectrum handling and calibration and the data presentation and storage.
Spectra extraction from 2D image
The 4 Spec E software enables the easy extraction of one or several spectra from a 2D image within defined regions. After the regions are defined it only requires one click to extract a set of spectra. Furthermore, the spectra extraction can be automatically performed during data acquisition. The individual spectra can be analyzed and plotted in the catalog data presentation of 4 Spec E as shown below. The individual curve or a set of curves can be displayed and modified in the curve view.
Spectra handling and calibration
Individual spectra can be chosen to be processed in the curve data presentation. This allows quick access to the main spectroscopy functions of 4 Spec E. The curves can background corrected and calibrated. Up to 6 calibration points and a number of different fitting functions are available. The calibration data can be saved an loaded as soon as a calibration is established for a certain experimental setup.

Special care is taken to provide the calibration function for Raman scattering experiments. The Raman shift calibration can be done easily in the
4 Spec E software. Furthermore, the curves can be used as operand for mathematical operations between
curves and with constants. After processing and calibrating the curves the peaks are found by the build in peak finder and the peak integral of several peak can be determined and plotted versus time.
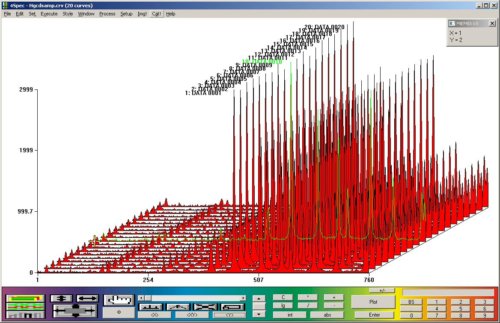
Data presentation and storage
4 Spec E software enables different ways of data presentation. To show the difference of a number of spectra a 2D or 3D overlay plot might be the right choice. For time depending evolution of a spectra the build in movie maker allows an intuitive data presentation. A very good visualization of spectra is achieved with the contour plot where several spectra are converted into a 2D color plot. The individual spectra can be stored in the crv-file format. Moreover, the spectra can be exported in txt-file format to read the curves with any other software tool.
All these functions make the 4 Spec E Software a comprehensive and user friendly spectroscopic analysis tool. A large variety of spectroscopy application benefit from the high
speed ICCD camera systems from Stanford Computer Optics.