Injected beam profile measurements at the
Australian Synchrotron
M. J. Boland, et al., from Australian Synchrotron used the 4 Picos ultra high speed ICCD camera to observe the beam profile of the synchrotron radiation on a turn-by-turn basis after injection.
Injected beam profile measurements on turn-by-turn basis
The Australian Synchrotron changed in May 2012 its user beam mode from decay mode to top-up injection. Therefore, the injection process become more important for the beam parameter of the synchrotron facility. By observing the beam profile and motion during injection it is planned to improve the injection efficiency and the beam stability during injection. For this goal the fast gated intensified CCD camera was used to image the beam provile on a tun-by-turn basis in the visible light region.
Experimental setup of the beam profile measurement
These measurements are performed in the optical diagnostic beamline (ODB) of the Australian Synchrotron which is used to image the visible light from the injected electron beam. The 4 Picos ICCD camera provides a shortest shutter time of down to 200ps, sufficient to capture a single bunch of 23ps which are spaced by 2ns in the storage ring. In order to record the sequence of images it was necessary to check the reproducibility of the data. The injection process was determined to be stable enough since the position and profile for a given turn was very similar from injection to injection. Hence, events on a highly reproducible cycle – like injection – can be accurately measured.
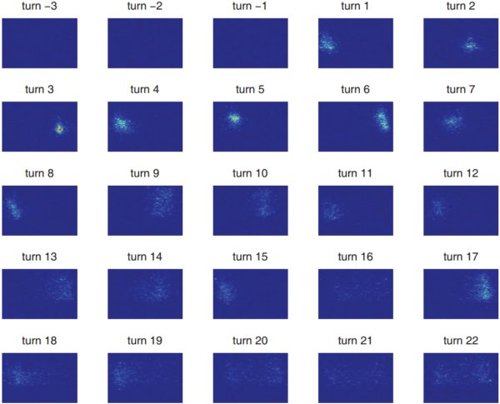
Turn-by-turn beam profiles after injection
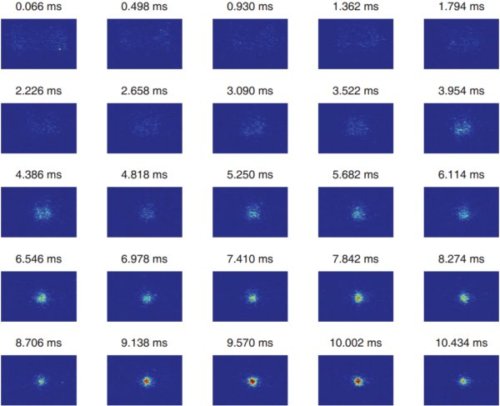
The figure above shows the beam profile for the first 22 turns after injection into the storage ring. The dark field frame of turn-1 was subtracted from the subsequent frames to remove the background noise. For the first 8 turns the beam seems to oscillate about the central beam exit indicate great qualitative agreement with a simulation performed by the authors. However, from turn 9 onwards the beam appears to decohere and filament into a large diffuse blob covering the whole of the injection coordinate space. As it can be seen in the figure below this diffuse beam profile persists for several thousands of turns until the beam damps down into a smaller profile.
Highly accurate beam profile of synchrotron radiation
The 4 Picos fast gating intensified CCD camera was used to observe the beam profile at the Australian Synchrotron on a turn-by-turn basis in the visible light region. The measurement technique will be used to tune the storage ring injection process.
Title: Turn-by-turn observation of the injected beam profile at the Australian
Synchrotron storage ring.
Author: M.J. Boland, T. Mitsuhashi and
K.P. Wootton
Institute: Australian Synchrotron, Clayton, Victoria, Australia